Any analysis of player performance must account for the various factors that can affect it, such as:
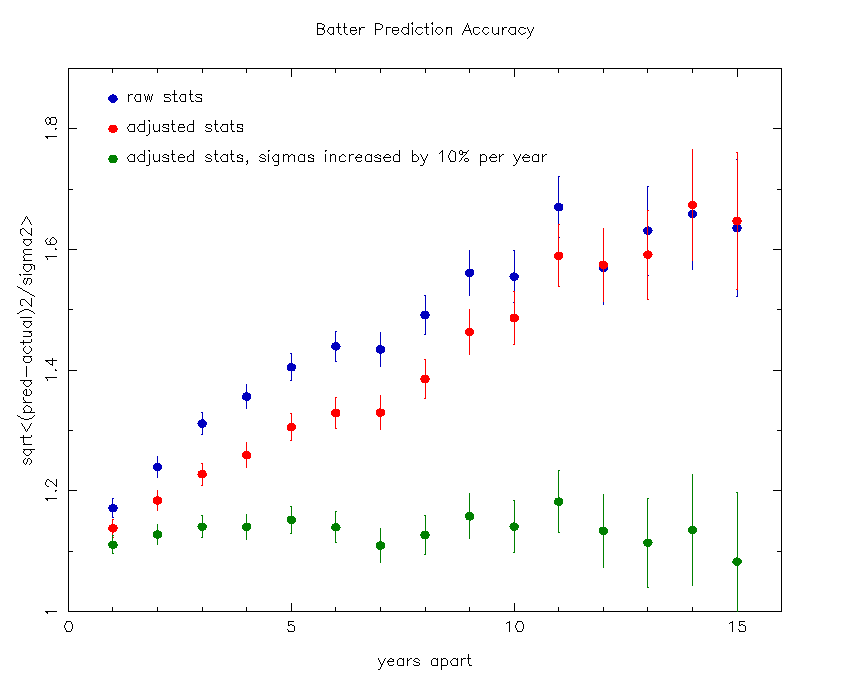
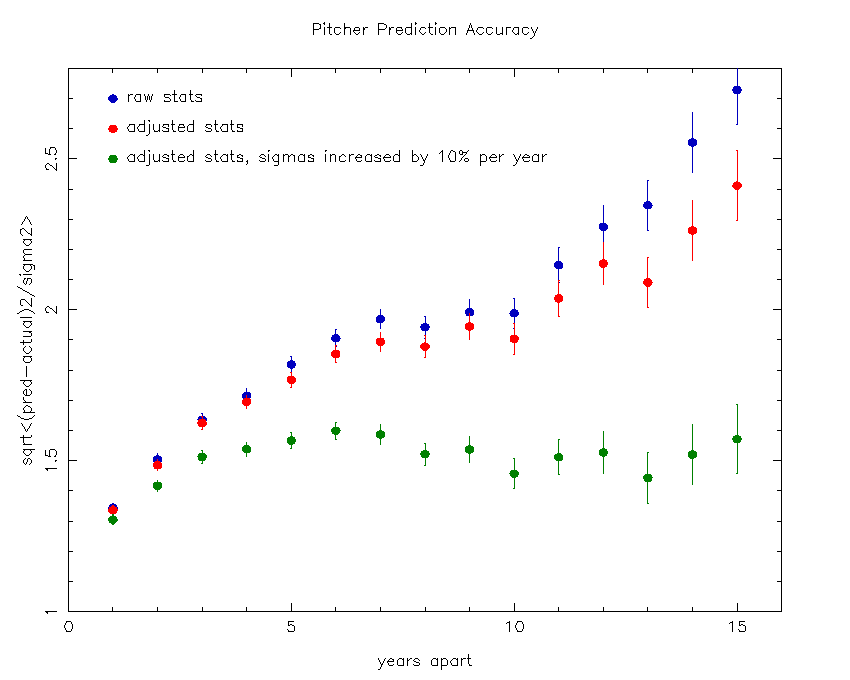
By using stats adjusted for the above factors, tighter correlation can be seen between a player's stats in multiple seasons. The following figures shows the agreement between raw (blue) and adjusted (red) stats. You will see that, even with the adjustments, the similarity between statistics from one year to another year decreases as the number of years apart increases.
The green dots, which are fairly flat, indicate that even the adjusted stats are not perfect predictors of player performance. There is an inherent 10% per year inaccuracy in these predictions. This is handled by reducing the weight given to a player's stats by 10% for each season. So, if a player had 100 plate appearances each of the past two seasons, you're best off treating the past season as 90 appearances and the previous season as 81 appearances when predicting for the upcoming season.

To evaluate if a player's performance has significantly changed from one year to another, one needs to boil down all of his statistics into a single number. To give the most accurate result, this number should translate directly into the odds of a team winning a game.
The metric I'll use is "wins created", in which each outcome is scored based on the average effect it has on a team winning. For example, the average single in a baseball game increases the team's odds of winning a game by 7%. So, I'll count a single as 0.07.
Another issue is that individual player statistics tend to be very random. A player who gets a bunch of triples one season may have just gotten lucky. So, in predicting future performance, one has to expect that some amount of a player's deviation from average performance was due to luck that won't be repeated the following year. As an example, hitters retain about 40% of their single-hitting rate from one year to the next (so, a player who hit .300 one year in a .260 league is most likely to hit around .276 the following). Pitchers, meanwhile, retain only about 20% of their single-hitting rate (a pitcher who allowed a .300 average one year would be expected to give up around .268).
With the above method laid out, what follows are player performance (through the 2007 season) for four players mentioned in the Mitchell Report as having used steroids. The seasons in question are plotted in red.
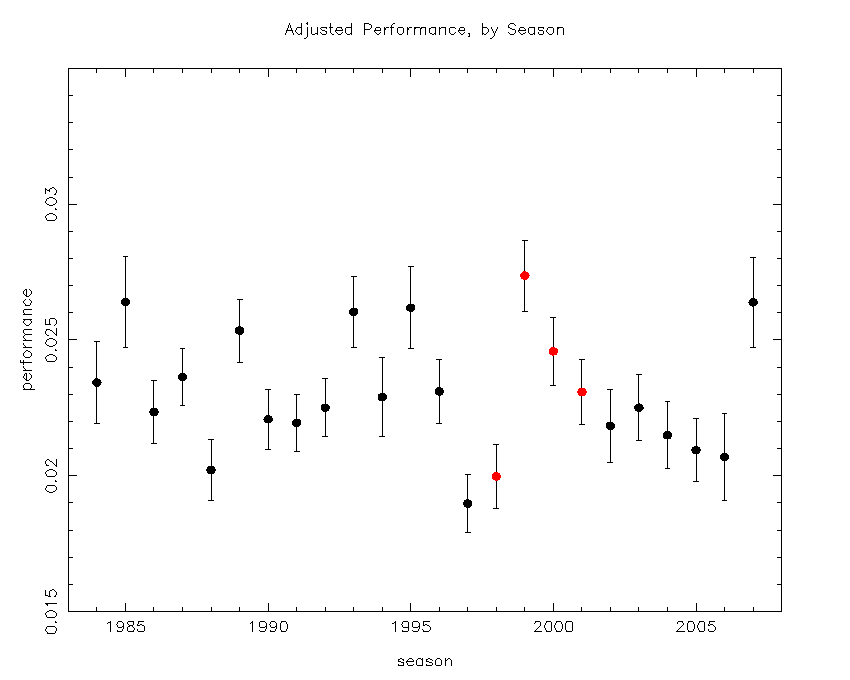
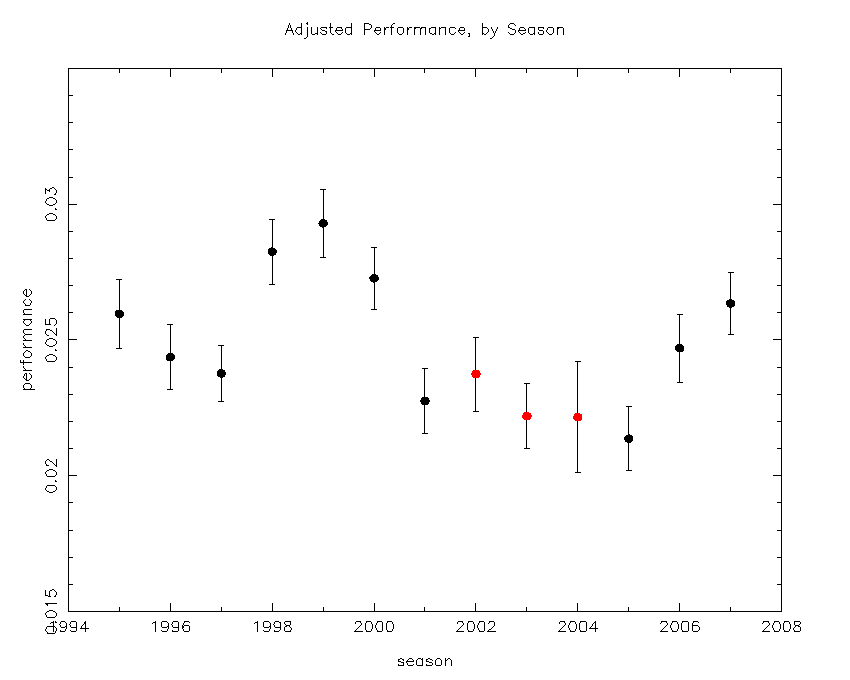
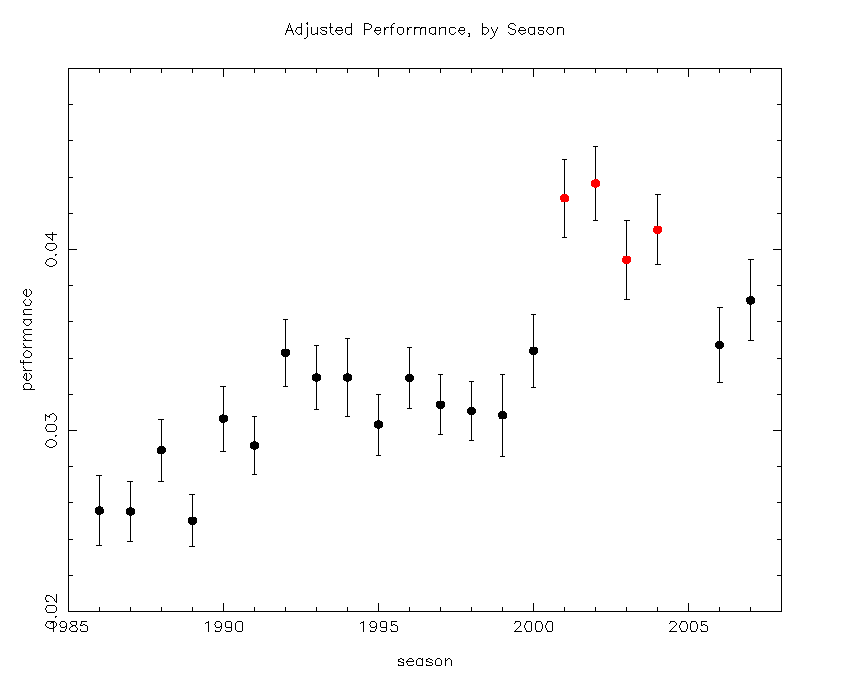
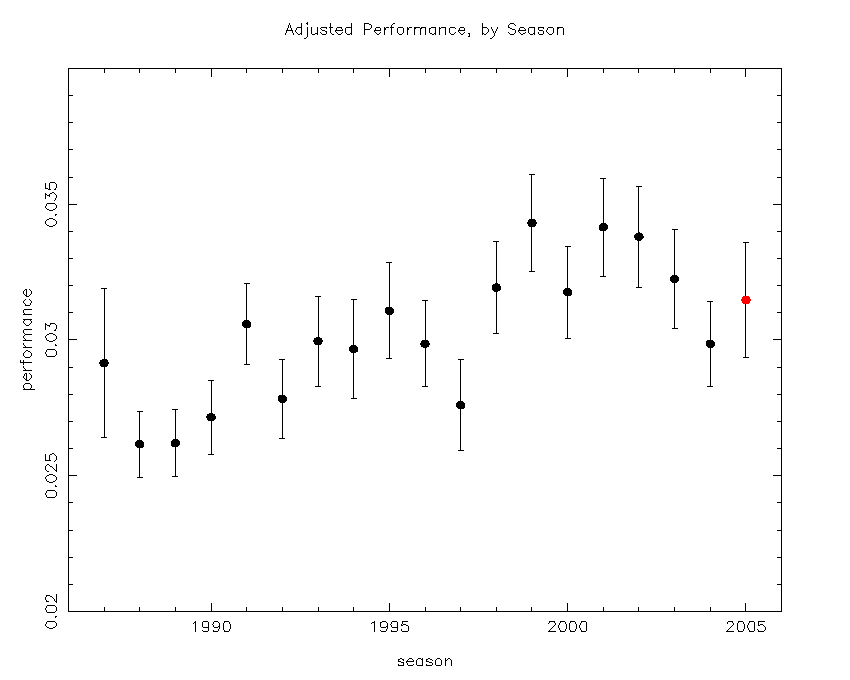
Overall, the players singled out in the Mitchell report did not appear to gain much from having used steroids. There were 32 hitters listed, who played 63 seasons (minimum 300 PA) under question, and their performance was improved by 3.4% (with an uncertainty in the mean of 1.2%). The 16 pitchers played a total of 35 seasons, and had performance improvements of 3.3% (with an uncertainty of 1.5%). So, the result is statistically significant at a 2-3 sigma level, but amounts to something like 10 points of batting average. The one exception is the BALCO-tied players, who averaged a 10% increase in production.
Several caveats apply to this conclusion:
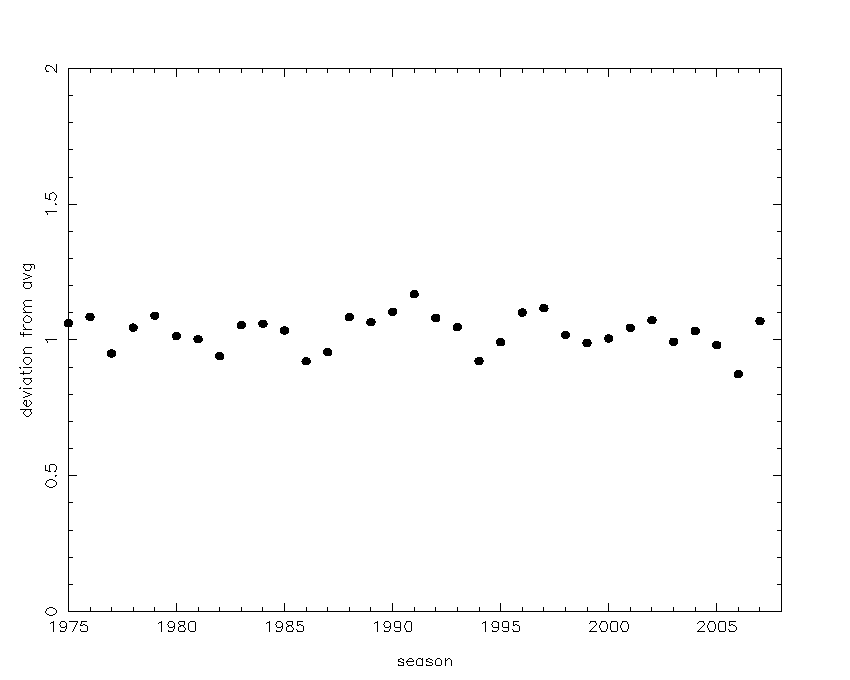
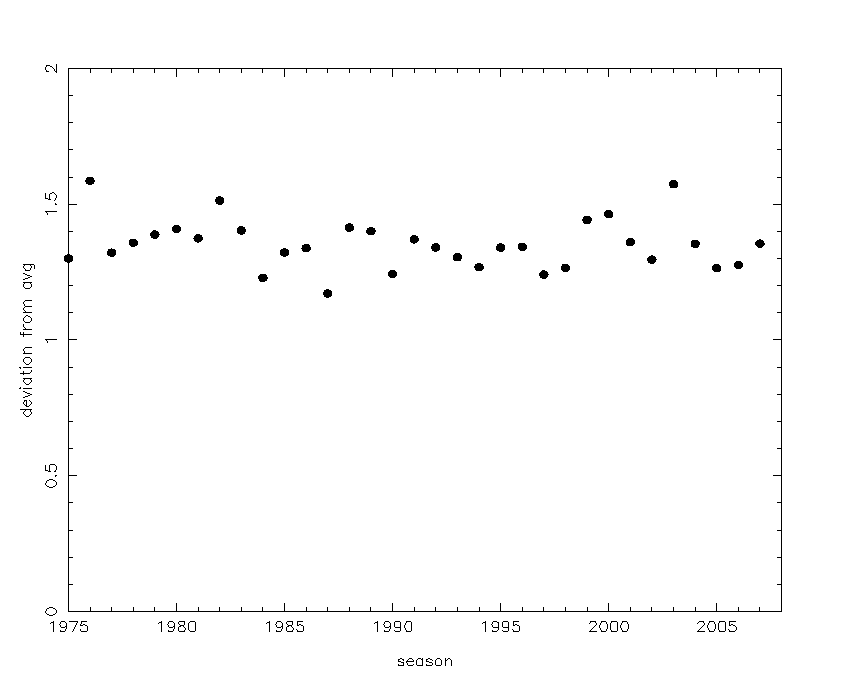
Another avenue we can use is to go the reverse route -- look at the statistical record for players with particularly unusual career trajectories. Specifically, I'm looking for two things:
Looking over data from 1975 through 2007, the following players meet the above criteria.
Note: if you use any of the facts, equations, or mathematical principles introduced here, you must give me credit.